
Reports
Reports turns every call into numbers you can act on: how many were answered, how long callers waited, who is busiest, which callers still need a call back, and how satisfied people are. Everything is compared with the period just before, so you can see what is getting better or worse.
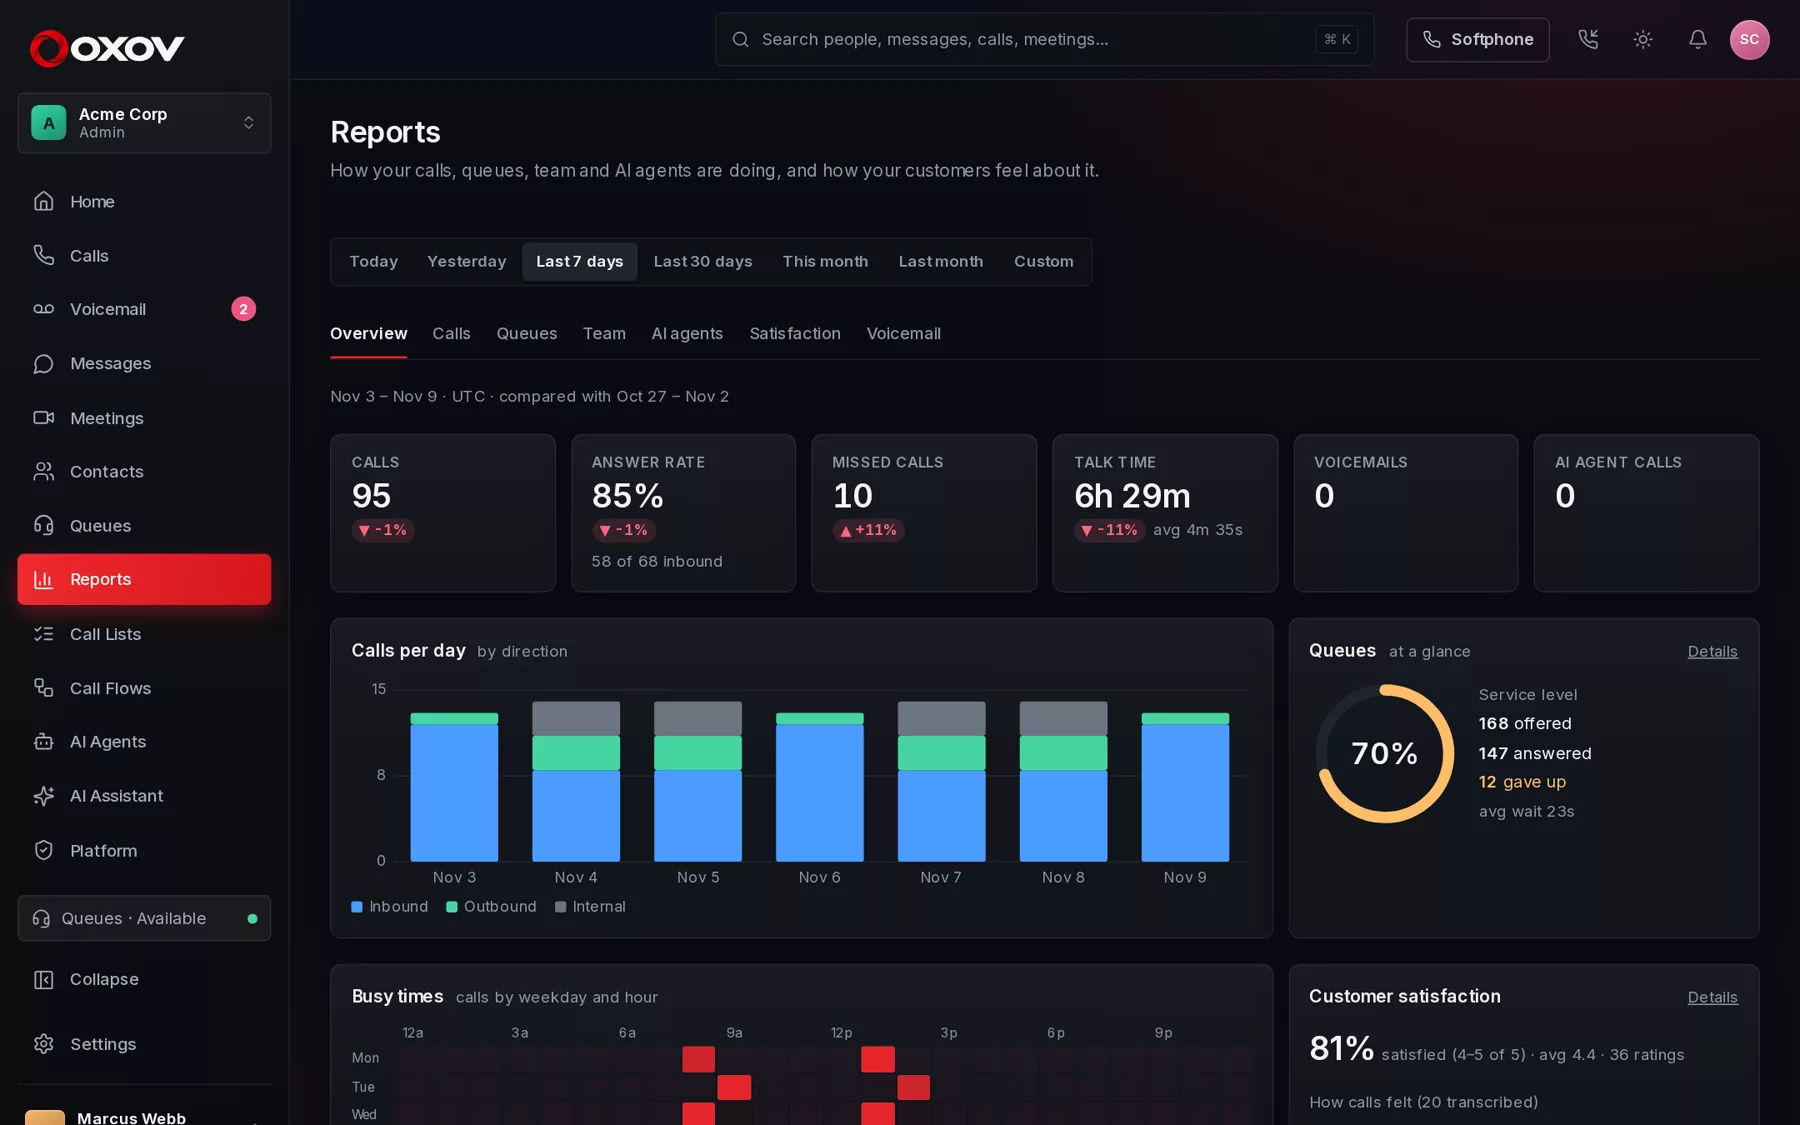
1Choose a period
Pick Today, Yesterday, the last 7 or 30 days, this or last month, or any Custom dates up to 92 days. Days start and end in your own time zone, and each figure shows how it moved against the same number of days just before (green is good news, red is not).
2What is in each report
| Tab | What it shows |
|---|---|
| Overview | Calls, answer rate, missed calls, talk time, voicemails and AI calls, calls per day by direction, busy times by weekday and hour, and snapshots of your queues and customer satisfaction. |
| Calls | Inbound, outbound and internal calls, when they happen, how long they last, your most active numbers, and missed calls marked Needs a call back or Followed up. |
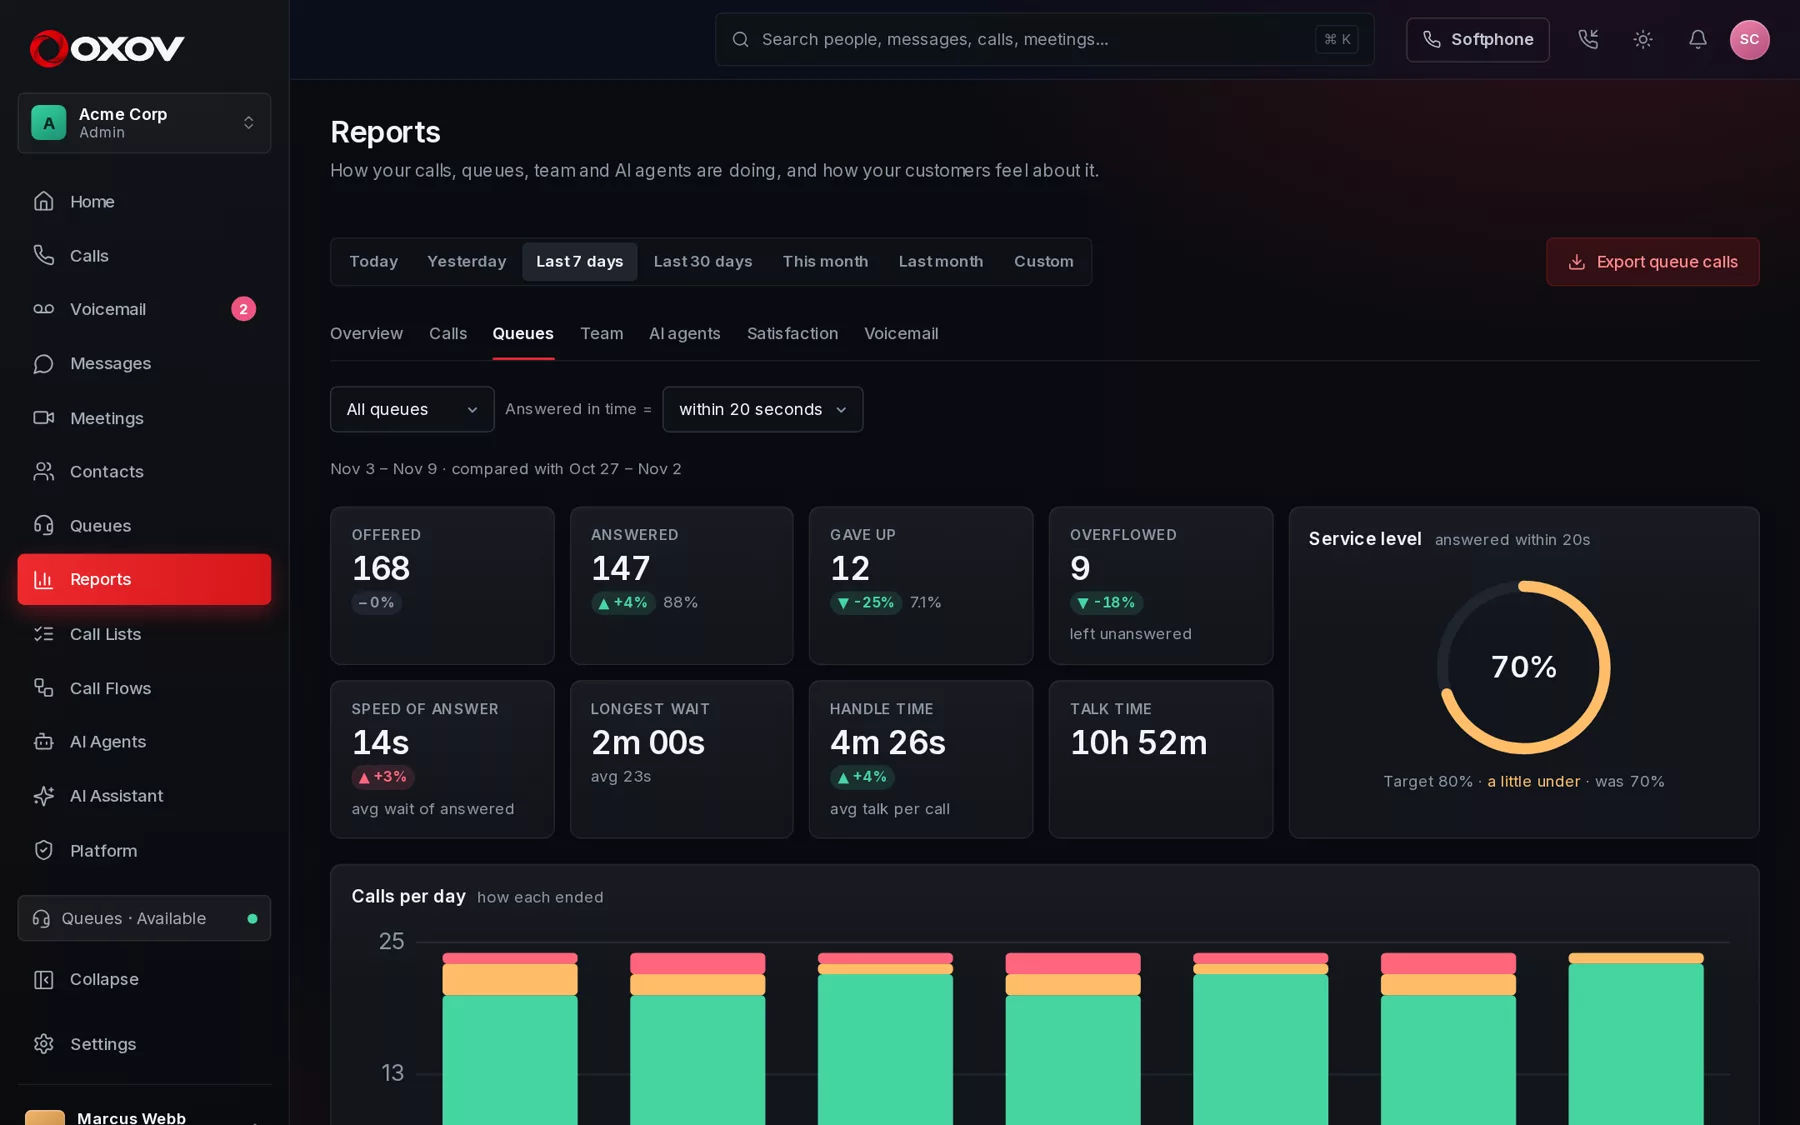
| Queues | Calls offered, answered and abandoned, service level, speed of answer, longest wait, handle time, how long callers waited, a busy-times heatmap, queue-by-queue comparison, each agent’s share, and the callers who gave up. |
| Team | Per person: calls, in and out, missed, talk time, average call, queue calls answered, caller rating and how their calls felt. |
| Coaching | How each person talks: talk share, interruptions, filler words and objection handling, with a leaderboard and trends. See Coaching below. |
| AI agents | Calls your voice agents handled, how they ended, how many they finished alone, what was passed to a person, messages taken, and how outbound calls turned out. |
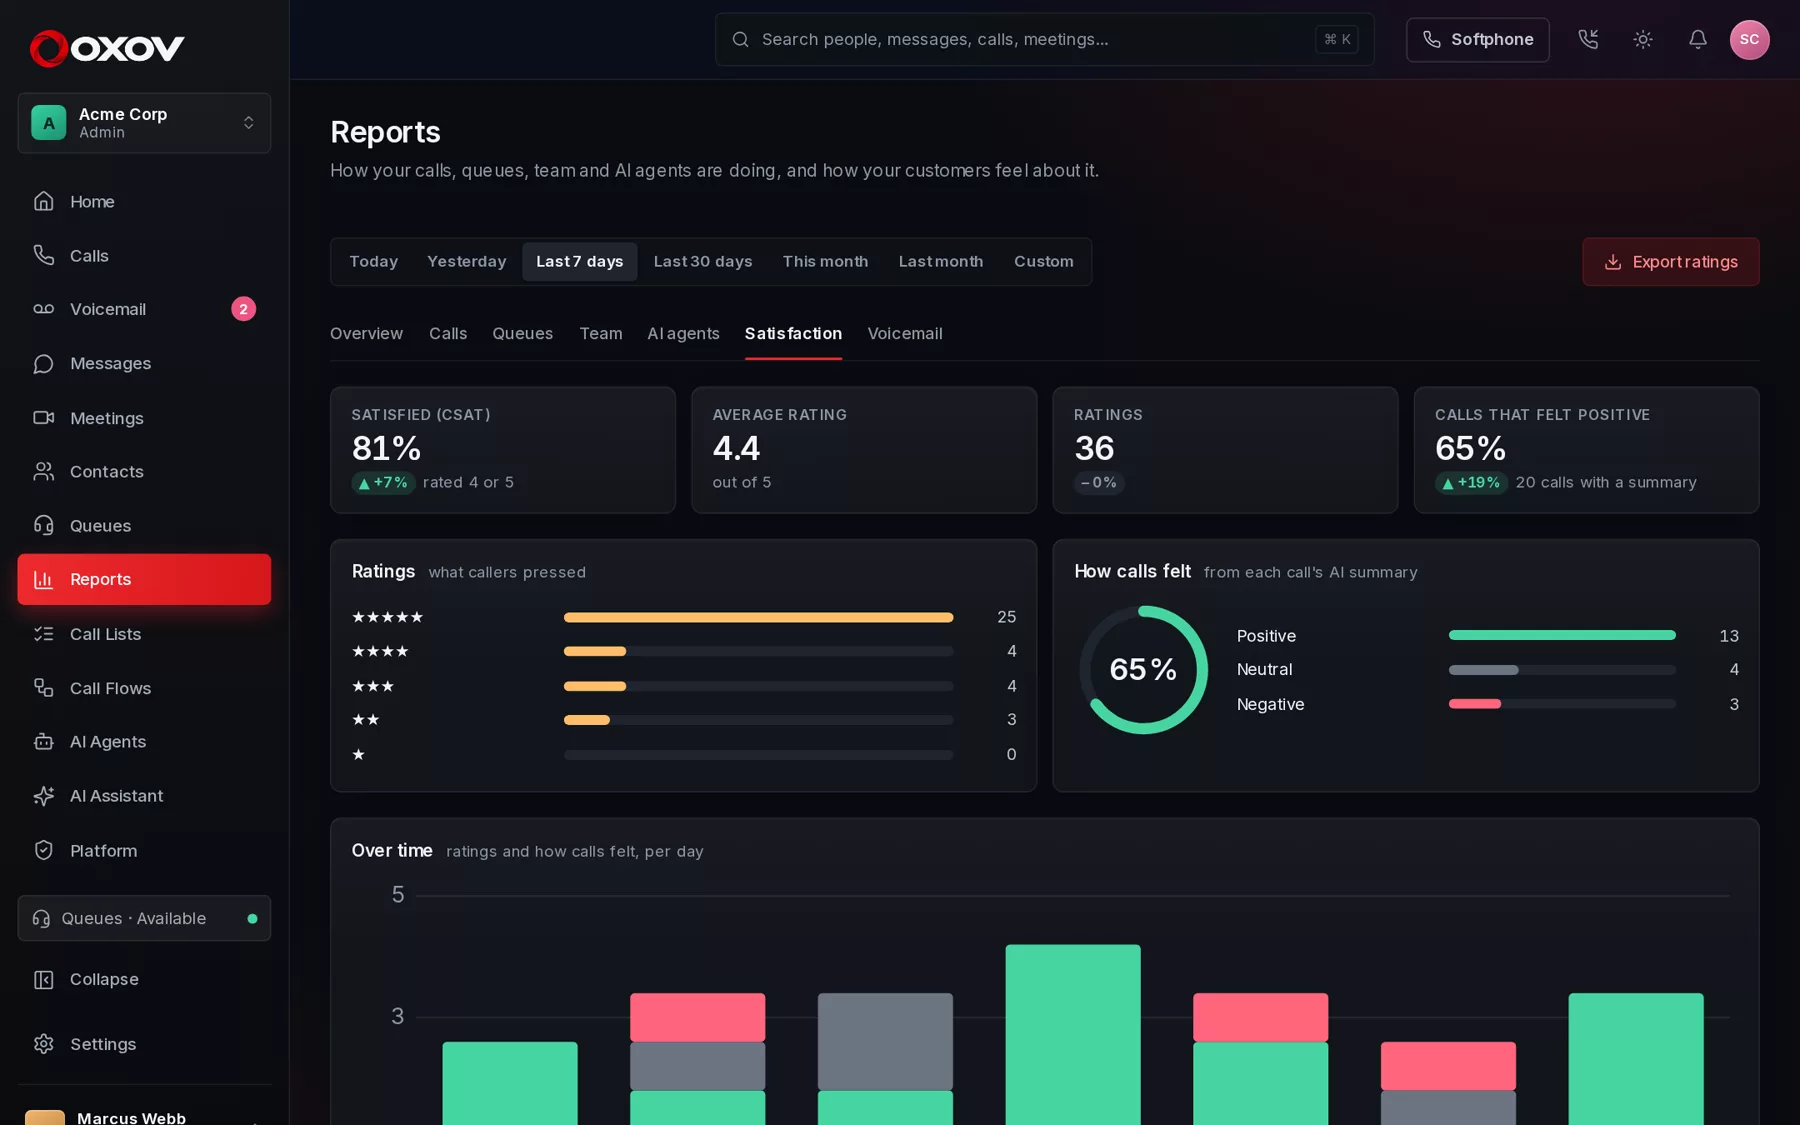
| Satisfaction | Caller ratings (CSAT), how calls felt from their AI summaries, results by queue and by agent, and the topics behind unhappy calls. |
| Voicemail | Messages received, when, for whom, and how many were turned into text. |
3Queue reports in detail
The queue report answers the questions supervisors ask every day: are we answering fast enough, and are people giving up?
- Service level is the share of calls answered within a time you choose (20 seconds by default). The ring turns amber and red below the 80% target.
- Speed of answer is how long answered callers waited, on average.
- Gave up counts callers who hung up while waiting. Hang-ups within 5 seconds are shown separately because they are usually wrong numbers, not service problems.
- Callers who gave up lists who to call back, and ticks them off once someone has.
- Filter to a single queue, or look at them all together.
4Customer satisfaction
There are two ways Cadence Talk learns how customers feel, and the Satisfaction tab shows both.
- Caller ratings: turn on Ask callers to rate the call in a queue, and callers press 1 to 5 after an agent helps them. CSAT is the share who gave 4 or 5.
- How calls felt: when call summaries are on, each summary notes whether the call was positive, neutral or negative. You see the mix, the trend and the topics in negative calls.
- Results by queue and by agent show where to coach and where to celebrate.
5Coaching and leaderboards
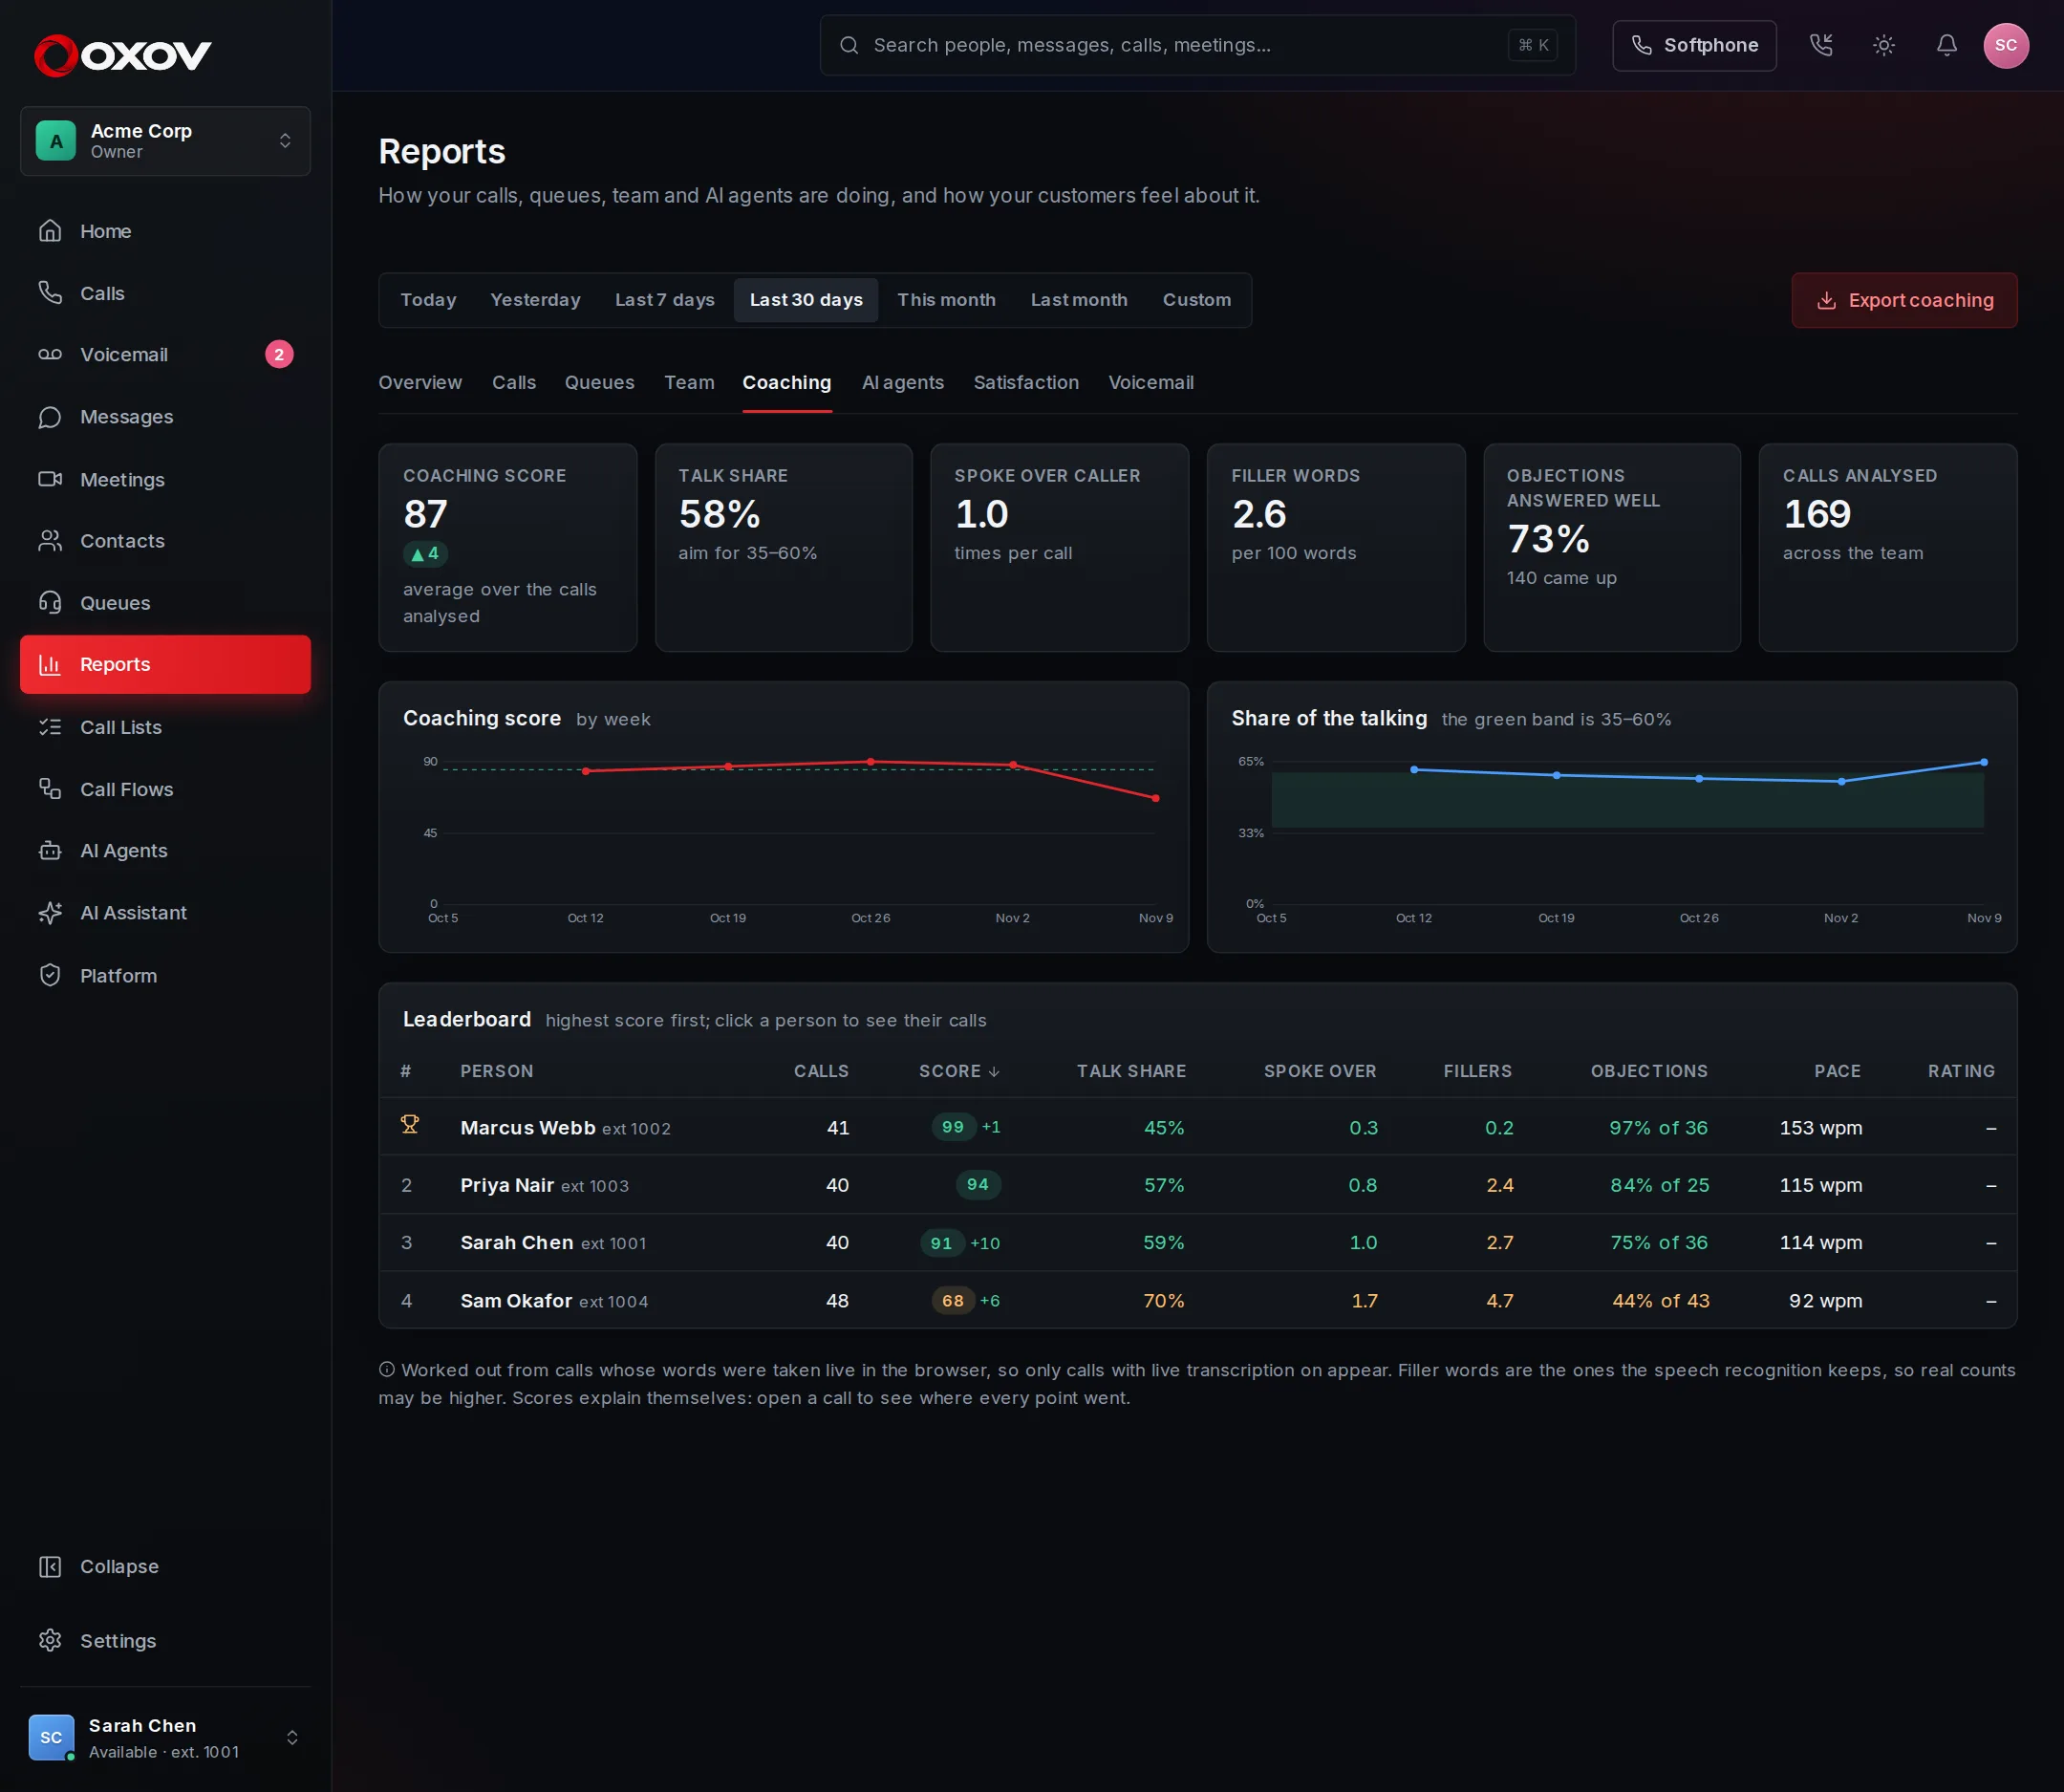
The Coaching tab shows how each person talks on calls, so you can praise what works and coach what does not. Every call whose words were taken live is analysed when it ends: who talked, when each person began speaking, and what was said.
| Measure | What it tells you |
|---|---|
| Talk share | The share of the talking that was theirs. Between 35% and 60% is the aim: more and they are not listening, far less and the call may be going nowhere. |
| Spoke over | Times they started speaking while the caller was still talking, per call. Each side is heard on its own channel, so a polite overlap of a word is not counted. |
| Fillers | “Um”, “basically”, “you know” and the like, per 100 words. Only filler the speech recognition keeps is counted, so real figures may be higher. |
| Objections | Price, timing, competitor, needs-approval, no-need and trust objections from the caller, and whether each was answered well (heard, then moved forward), partly or missed. |
| Pace, questions, silence | Words a minute, questions asked, the longest stretch without the caller speaking, and dead air. |
| Checklist | Of the live assist checklist, how much was done, and which required items were missed. |
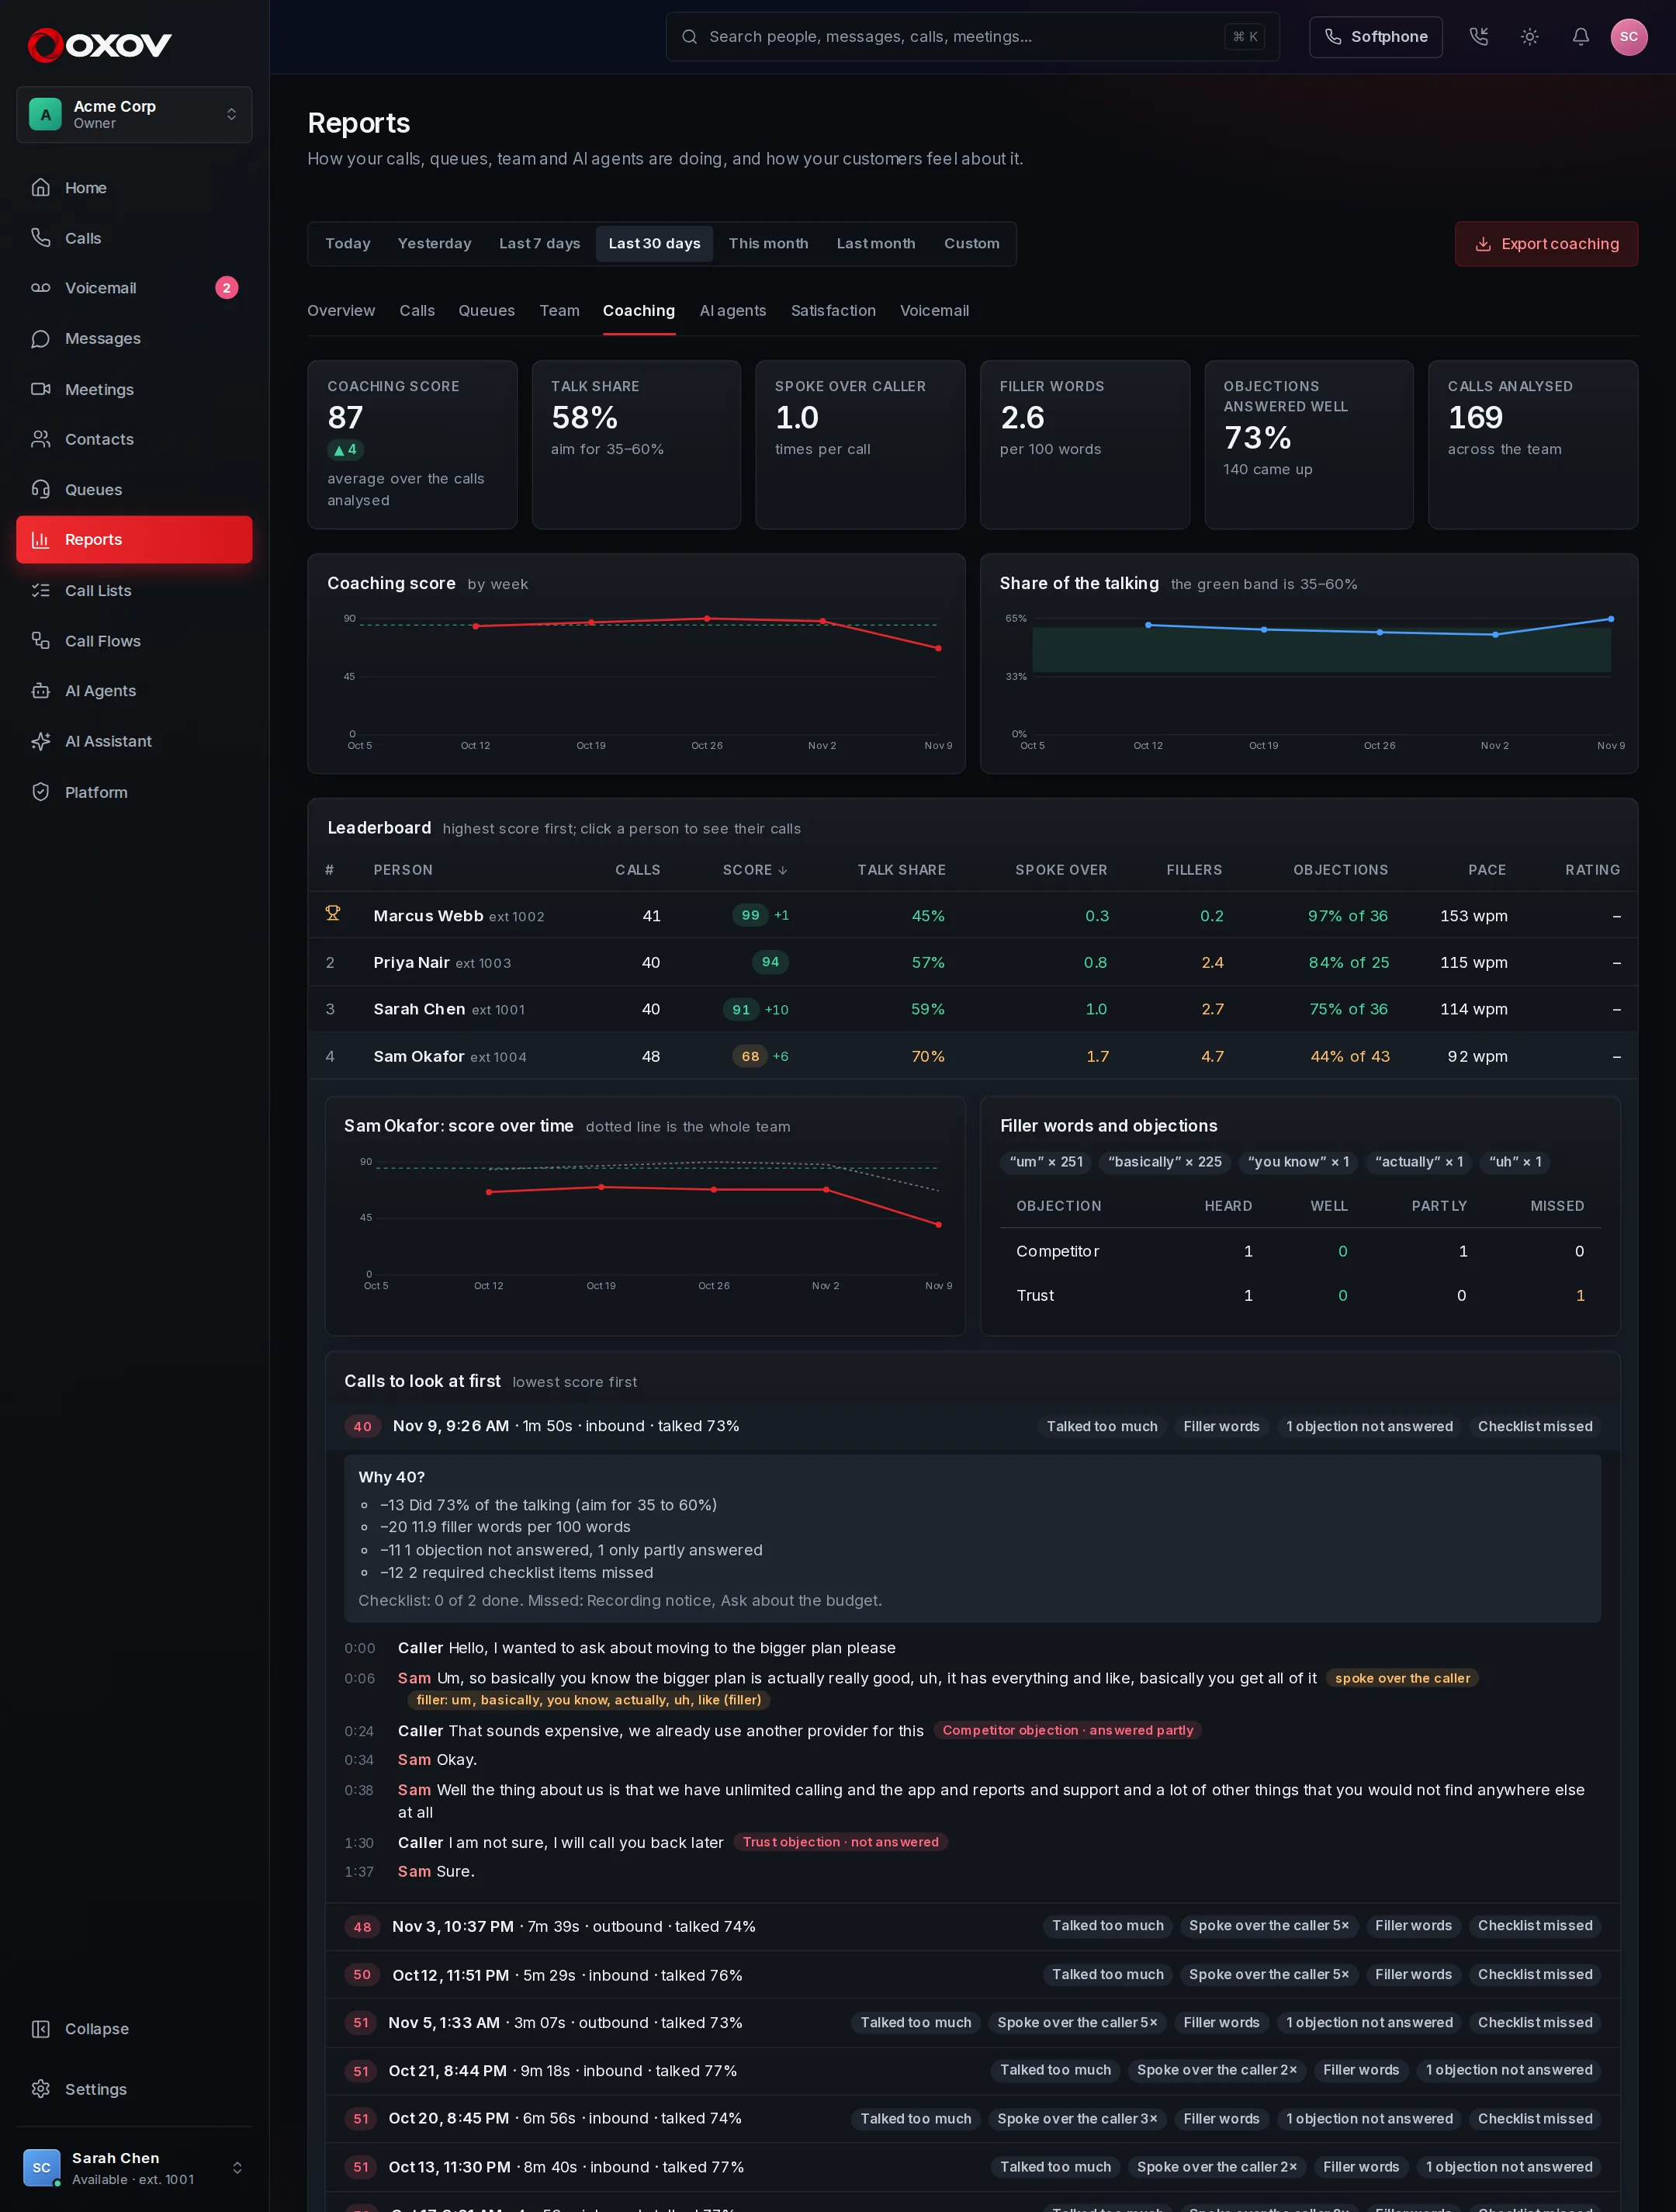
Click anyone on the leaderboard to see their score over time against the whole team, their top filler words, the objections they met and how they answered, and the calls to look at first, lowest score first. Open a call to read the words with each moment marked, and to see exactly where every point of the score went: nothing is a black box.
- Sort the leaderboard by any column. Long periods are shown week by week.
- Caller ratings (CSAT) appear beside each person when callers are asked to rate calls.
- Export coaching downloads every analysed call as a spreadsheet.
- Analyses are kept as long as call transcripts are.
What your team sees: My coaching
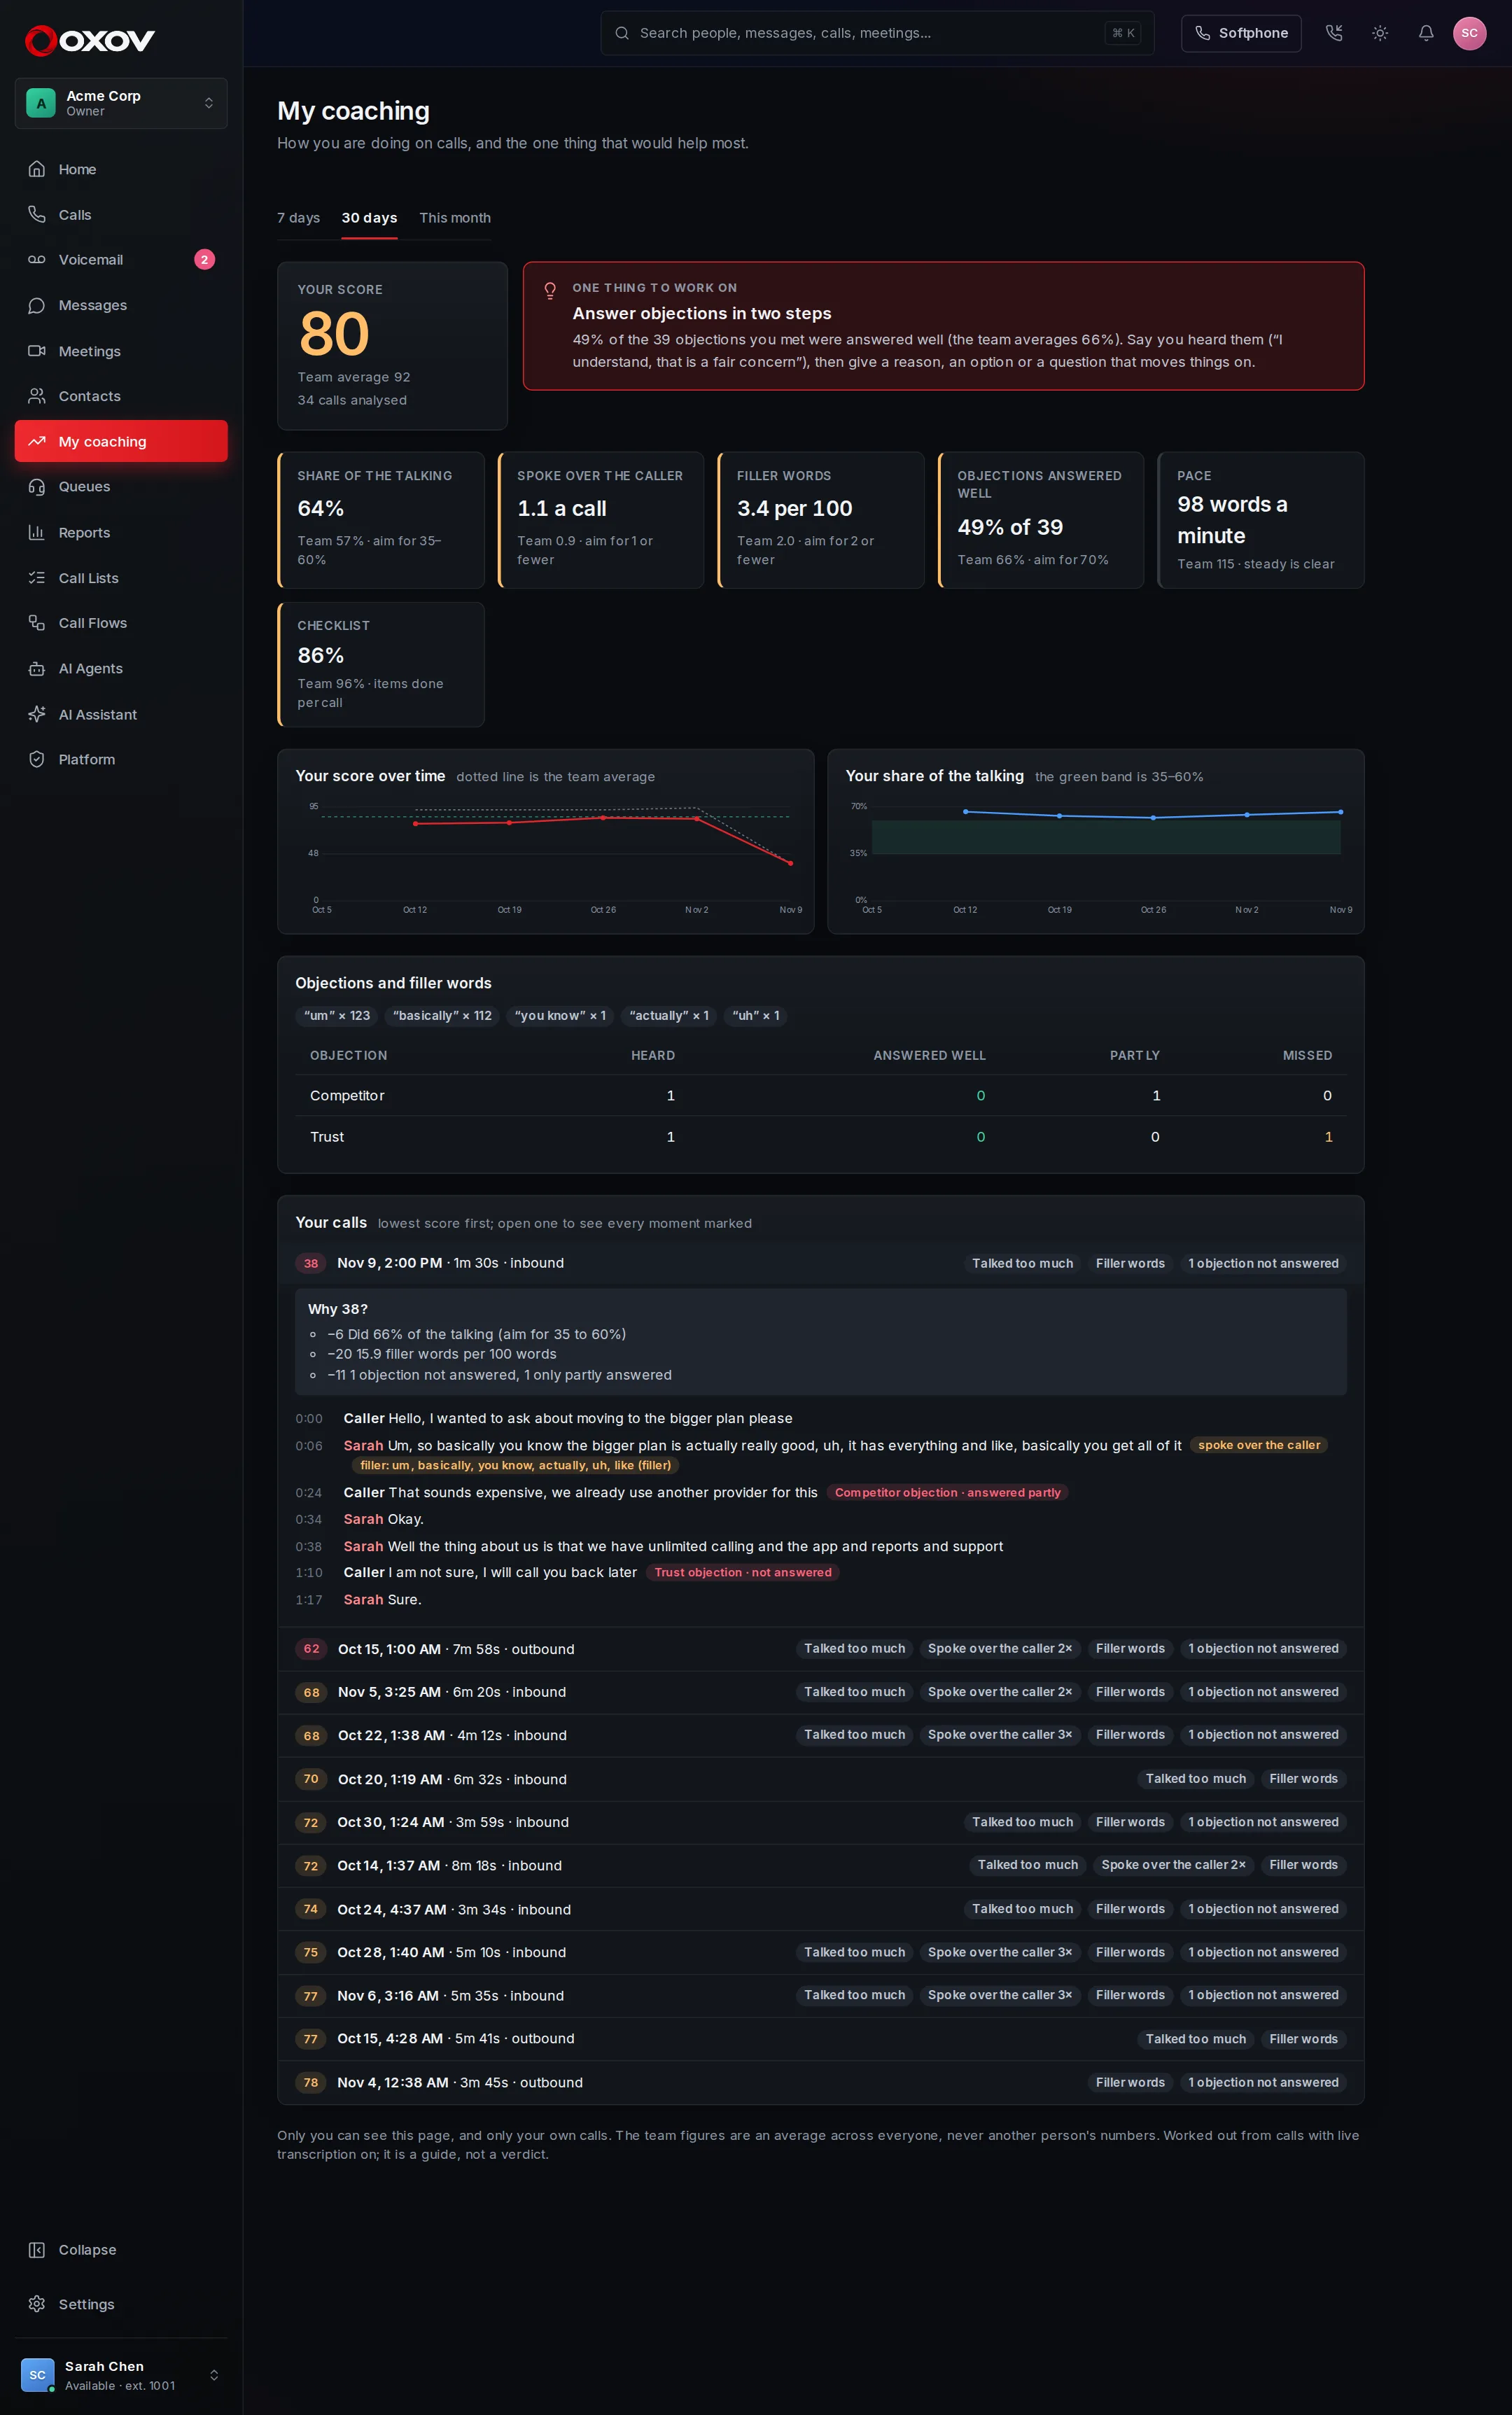
Everyone, not just supervisors, has a My coaching page in the sidebar. It shows only their own calls: a score, each measure beside the team average, a chart over time, and their calls with every moment marked. At the top is one thing to work on: the measure furthest from target, with something specific to try. Below it are up to three things that are going well, so it is not all criticism.
- The team figures are an average, never another person’s numbers, and are left out until at least three people have calls so an average cannot point at anyone.
- After a call ends, a How you did card on the wrap-up and the call details shows where the points went.
- Admins can switch it off under Admin → AI → Live assist & coaching → People can see their own coaching. Supervisors still see everyone in Reports.
6Take it with you
Each report has an Export button that downloads the figures behind it as a spreadsheet (CSV): the call log, queue calls, team, AI agent calls or ratings. Names that could confuse a spreadsheet are made safe automatically.